Measurement Logging
This program makes sequential
measurements and saves the results to a semi-colon delimited text file (*.csv)
which can be directly loaded into MS Excel and used to produce a chart of
the
measurements. Communication is through GPIB. It's very flexible and rate,
time, instrument, query command, conditional commands, parameters to be added to the file etc. are
fully selectable.
All settings could be saved at exit and loaded when the program
starts the next time. It is also possible to save and recall 5 different setups.
An Excel macro file and a sample printout could be
downloaded at the bottom of this page.
March 25, 2023 - New version 2.1
Bug
Fixes:
If "Convert from scientific
notation to decimal" was active and a Measurement string started with a
character other than a number the result would be shown as 0 (zero)
for no clearly obvious reason. Now, if a sequence is started a warning message will pop
up telling the user to open the "Test" window and either mask away the text or
continue
with the "Convert from scientific notation to
decimal " unselected. Opening the "Test" window will now automatically untick this
option.
The Conditional Command indicator (Bold blue text when active)
was not activated when a setting with functoion activated was loaded (Start Up or Saved).
A sequence could be started even if no data for X-axis was selected. Now a
warning messages is shown and the sequence won't start.
If used in an
environment using point for decimal delimiter csv-files didn't open correctly in
Excel.
Conversion from scientific notation to decimal didn't work
properly on very high numbers.
Changes:
Options to select point or comma as decimal delimiter were removed and the
delimiter is now determined at start based on the current Windows setting.
Menu items
to Recall and Save settings changed to show the actual names of settings rather
than only "Setting1, Setting2 ..." and so on up to 5.
The Menu item to
set the path to the Excel exe file changed to also show the currently saved path and
select either keep it or save a new.
The Menu items to save and recall
settings now show the actual names of the saved settings as opposed to Setting1,
Setting2 etc.
Result string trimmed to remove any leading and/or
trailing spaces.
OK button on Test window is now disabled if no change
was done.
OK button on Conditional Commands window now disabled if no
change was done.
Add and Clear buttons on Test window swapped
positions.
The label to the left of X-axis options changed from
"Include:" to "X-axis:".
The label "Total Time:" changed to "Total Time
(hr:min):"
The Excel macro to create charts greatly
improved.
New:
Menu item to set or show the path
to the Excel macro file added.
Menu item to send the current
csv-file to the Excel macro file added.
Warning message added on Test window
to remove or keep exclusions if Measurement Query or Device has changed.
The Conditional
Command feature can now be used wihout a GPIB command i.e. only terminate
sequence if condition is met.
Changes from 1.5 to 2.0:
Bug
Fixes:
Run Time Error if Path
Button is clicked and the path didn't exist.
Clearing Device ID didn't clear ID Response.
Loading a saved setting with a second GPIB address that didn't
exists didn't turn off Cond Commands.
File and Tools menus
were not disabled during a running sequence.
Hitting Enter in timing
boxes to select Apply possible even when Apply Button was disabled.
Entering Total Minutes
as 0:seconds e.g. 0:30 gave incorret total time.
Changes:
In Conditional Command
number of selectable "Consecutive Conditions Met" increased to 30.
In Conditional Command
number of selectable percent settings changed to 30.
Entering Total Time
changed to Hours:Minutes rather than Minutes:Seconds. Number only is hours.
Code for input boxes
changed to accept only valid characters, Timing boxes will translate period and
comma to colon.
Text in Sequence Frame
Text boxes changed when a sequence was manually stopped and color changed to red
of the first box.
The word "Aborted" in the
Sequence in Progress Text box changed to "Terminated".
The word "Done" in the
Sequence in Progress Text box changed to "Completed".
Label Current
Measurement changed to Latest Measurement.
Color of Conditional
Commands label text on Sequence frame changed to blue from red.
Some message boxes
slightly changed in text and graphic symbol.
New:
In Conditional Command now
possible to have both one of < , > , = and "Less than Max Value" conditions
active at the same time.
In Conditional Command >
and < expressions now also use expression plus or minus percents rather than
only exact value . For
exact value use 0%.
In Conditional Command "Less
than Max Value" now includes target values in percent of max rather than just
less. For exact value use 0%.
In Conditional Command "Less
than Max Value" now also have an option to select Less Than Max Value minus an absolute
value.
Added Menu items to save
five
more settings than just last one i.e. Startup plus five other settings.
Added Menu items to recall
five saved settings plus Startup and Default settings.
Added a message box to show
Conditional Command data e.g. Conditional type, reason for aborted sequence,
target values and last measurement in case of an terminated sequence.
Shows up at a terminated sequence but can also be opened from the Tools menu.
Added Menu item under
About to show Conditional Command settings, enabled all the time when
Conditional Command is active.
Added button "Create New
Folder" on "Select Path" window.
Added Query to add a
prefix to a log-file or replace it in case it already exists.
Added option on Test
window to convert measurements in Scientific notation to Decimal notation.
Added a popup menu to
the File Name Text box to open the current file in Excel.
Most Text boxes now cleared by double
click.
DeviceID and Measurement
Query Text boxes now change text in lower case to upper case.
Added Tool Tips on Time
labels to show valid time formats.
Change background color
of Latest Measurement text box whenever a condition is met.
Note: Saved Conditional
Command settings from an earlier versions will not be correctly recalled with
this version.
Changes from 1.41 to 1.5:
Bug Fixes:
Actual Number of
consecutive measurements needed to stop the sequence was one less than indicated
on the Conditional Commands window.
Changes:
The Target Value text
box on Conditional Commands window now only accept plus, minus, comma, period
and numbers.
The text of the Sequence
In Progress textbox on the main window changed to red for message "Aborted"
after a condition was met and the sequence was stopped.
GPIB Communicator (on
Tools Menu) changed to the latest version (1.91).
URL to check for updates
changed to the actual page rather than an index page.
New:
Added Conditional Commands
setting to abort a sequence if the measured value is less than the accumulated
Max value.
Changes from 1.40 to 1.41:
Bug Fixes:
The File Name box
is now prevented from containing path. Should be filename only.
Selecting another
drive in the Path box a second time could cause a false error.
Changes:
Now possible to
view the About window with a command line switch /?. A command file doing
this is now included in the setup.
Changes from 1.32 to 1.40:
Bug Fixes:
The value of the
manually selected GPIB address was not saved and the list defaulted to the
lowest found address on the bus. Now it is saved.
Should the saved address not be available on the bus the list shows "None".
The dialog box to set Excel path always started with "c:\".
Now it starts with the currently set path.
The Log File path box now changes according to the path of
the selected Log File name when the Log File name is changed via the dialog box.
Path cannot be entered in the Log File box.
Changes:
Settings now
stored in Registry rather than in an ini-file.
Set Log File Name
added to File Menu
Changes from 1.31 to 1.32:
BugFixes:
Couldn't load the
log file with MS Excel from the program if the path contained spaces e.g.
c:\Documents and Settings\User\My Documents
Changes:
Newer version
(v1.83) of GPIBcomm.
Changes from 1.3 to 1.31:
Bug Fixes:
Incorrect time
display in the Sequence frame, Elapsed Time, Remaining Time and Time From Start
in Log file when minutes was selected fixed.
Only displayed time was wrong, the actual sequence was OK.
Misspelled keyword
in the log file corrected. This will result in an incorrect Command when
starting with an ini-file from previous version - just correct and resave.
Changes:
An error message
added if Time Interval is in seconds and time is entered with a colon e.g. 1:30.
Sequence frame
caption color changed to Red when Conditional Command is ON.
Sequence frame
caption now also says Conditional Command OFF (in black) when Conditional
Command is OFF.
Button for
Conditional Command added to main window in addition to the Menu item.
The way the
dropdown lists on Conditional Command window are initiated changed. This will
result in wrong settings when starting with an ini-file from previous version -
just correct and resave.
New warning message if Conditional Command is selected and
not all parameters are defined.
The help message
in the Test Measurement Query window altered to make it more understandable.
Changes from 1.2.2 to 1.3:
Bug Fixes:
Connect button now
isn't enabled when no saved settings are available (i.e. ini-file missing).
Changes:
Newer version
(v1.8) of GPIBcomm.
New:
Function to send a
GPIB command to a second device at certain conditions (see below).
Changes from 1.2.1 to 1.2.2:
Two minor bugs fixed:
Some devices could have timing problems at Connect causing Read Error.
DeviceID, used to identify at
Connect, was case sensitive.
Changes from 1.2.0 to 1.2.1:
Bug Fixes:
Changing between Sec and Min now doesn't clear Time Interval (introduced with
v1.1).
All Frames except Sequence now disabled during a running
sequence.
Time is now displayed correctly, also hours.
Stop
sequence now stops the sequence immediately rather than waiting for the current
sequence to finish.
Enabling/disabling of several buttons and boxes
corrected.
Timing Frame now doesn't show 0 seconds if there are no
seconds in the sequence (i.e. 1 hour 1 minute 0 seconds to 1 hour 1 minute).
Path to Excel-file now loads correctly at start.
No Save question now at quit if nothing changed.
New:
Time from start
in log file now in format hh:mm:ss instead of seconds.
Info button on
Test window renamed to Help.
Changes from 1.1.0 to 1.2.0:
Known Bugs:
Yes, there are few and I'm
working on it. Hopefully a new version will be available soon.
New:
GPIB
address could now be selected manually (for instruments not responding to ID? or
*IDN?.
Another GPIB device can now be connected without having to
restart the program.
Wildcards can now be used to exclude characters
of the query response string and an Info button added.
Space(s) in the
beginning of Exclude strings now permitted.
Changes from 1.0.0 to 1.1.0:
Changes:
A
total redesign of the main window.
Changing between Sec and Min for
Time Interval now clears Time Interval box.
Latest Measurement label
changed to Current Measurement.
Stop Sequence now clears progress bar.
Pressing Enter at any box inside Timing frame triggers Apply.
The way the Log File
path was defined changed, the path has been split into Path and File Name.
Bug Fixes:
Mini button added.
Total Minutes didn't clear Number of Sequences if
beginning with a 0 (zero).
Start Sequence button became enabled after
first sequence, now stays disabled until finished.
Seconds and minutes in
Time Interval didn't have the same result in sequences i.e. 5 secs vs 0:05 min,
New:
Menu bar.
GPIB Communicator added as part of the program for easy testing of commands.
Open current log file with Excel from a menu.
About window.
Show Remaining Sequences.
Show Elapsed Time.
Show Remaining Time.
Version 1.0.0
Initial version.
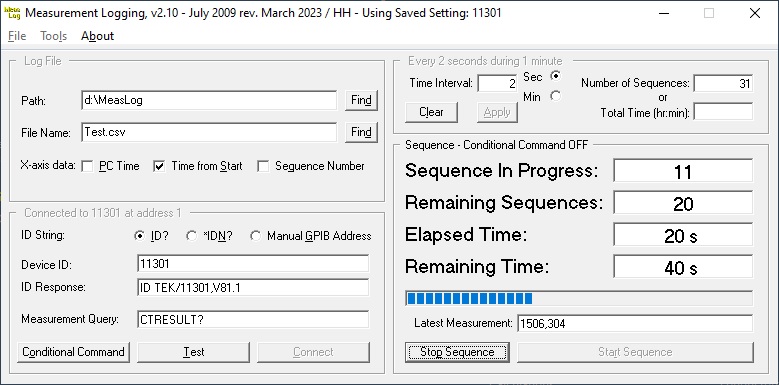
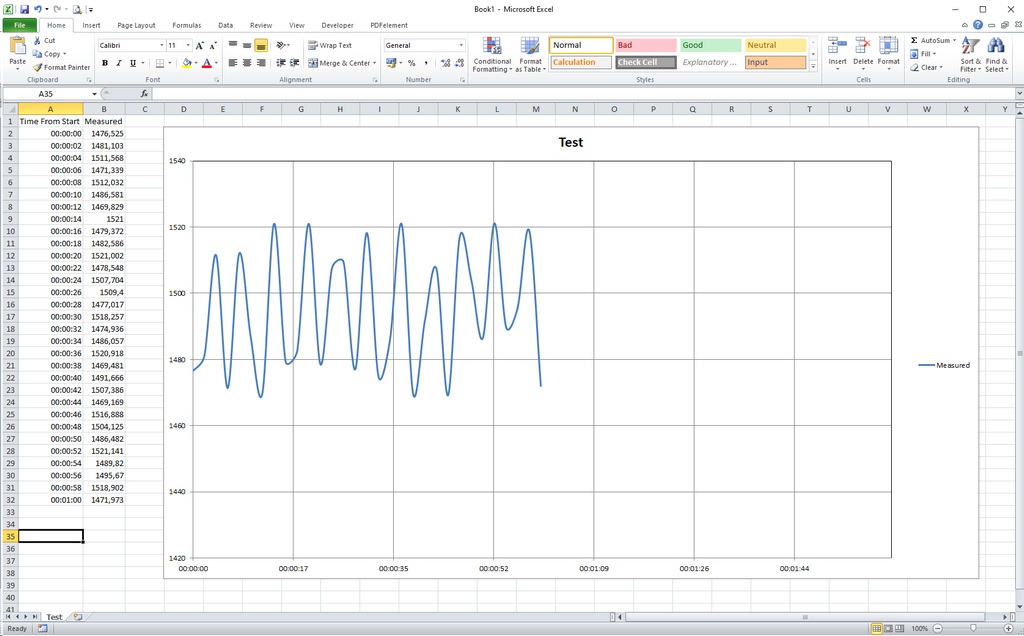
Here is a screen shot of a
measurement sequence, every 2 seconds during 1 minute.
Number of Sequences (= measurements)
says 31 because the first one is always done at time = 0.
The source is a Tek
11301 oscilloscope doing frequence measurements on a 1.5 kHz sinewave.
Operation is not all obvious so some explanation may be needed:
Time
Interval:
The time between measurements in seconds or minutes.
Format for Minutes is as minutes:seconds or minutes only.
Comma or period will be translated to colon and Enter = Apply.
Number
of Sequences or Total Time:
Only one could be entered. Click Apply when
done.
Format for Total Time is hours:minutes, hours or :minutes.
If shorter than 1 minute is needed use Number of Sequences i.e. Number of
Sequences = (Total Time / Time interval) +1.
Comma or period will be translated to colon and Enter = Apply.
Log
File:
The path and name of the file where the data is stored.
Path: Click Find to open another window and select a folder.
File Name: Either click Find or enter manually in the text box.
Some countries use a comma for decimal separator so for Excel to understand the
data select the right one for you.
ID String:
The
ID query command the program sends to identify
an instrument.
Most of
Tek's newer instruments are backwards compatible so they understand both but
many others don't.
Manual GPIB Address:
Select this to manually connect to an available GPIB address
in the drop down list which will appear.
This is to be used when an instrument won't respond to either ID? or *IDN?.
Device ID:
The expected reply from the selected instrument. It
could be partial.
ID
response:
The actual ID response from the instrument.
Measurement Query:
The command query used to force the instrument to send a
measurement value.
This could also be defined on the Test window.
Conditional Command:
Click this button to open the Conditional Commands
window. Same as Tools/Conditional Command, see below.
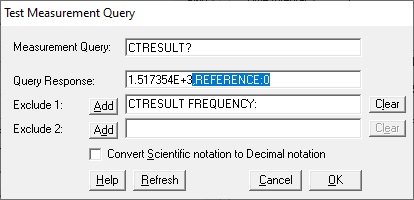
Test:
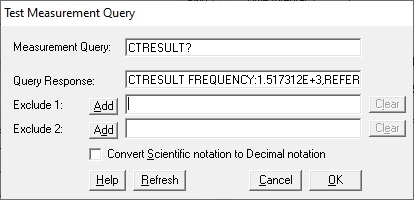
This screen will show the actual measurement response.
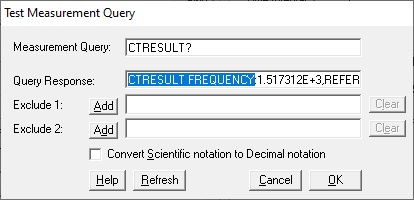
Select the leading text to be exluded.
Then
click Add.
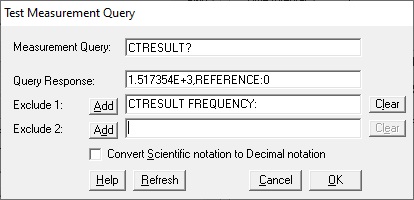
The masked Query Response is shown.
Select the trailing text to be exluded.
Then
click Add.
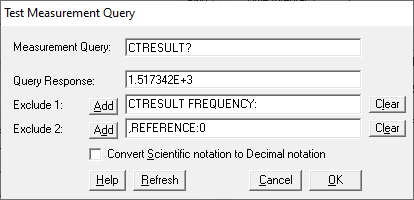
The masked Query Response is shown.
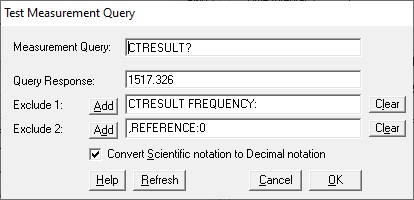
Tick the checkbox if you want Scientific Notation measurement response to be converted to Decimal Notation.
The Exclude boxes can also be
manually entered/edited. Doubleclick in any box will clear it.
The excluded text is the actual string shown in the Exclude text boxes and
not absolute positions in the original string.
Some wildcards can be used,
click Help for rules.
When done click OK to save the data
and return to the
main screen .
Connect:
Click this button and if the instrument is found on the bus it's full ID response is
shown in the ID Response text box.
If more
than one instrument could reply to the query only the one with the lowest
address will. If one with higher address
is needed use the Manual GPIB address option.
Start Sequence:
Click this
button to initiate the
sequence.
Menues:
Tools/GPIB
Comm:
Can be used to communicate with the instrument to explore commands and
queries.
Tools/Conditional Command (New in v1.3):
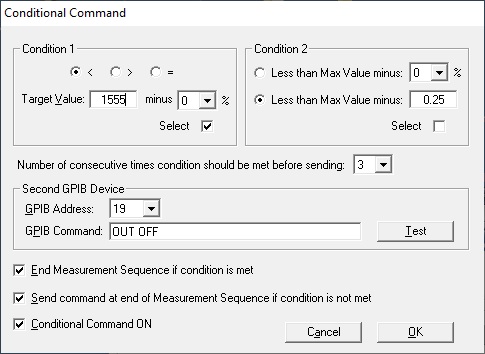
Conditional Comman lets you define a command, a device and conditions to be met for a command to be sent to a
second
device or even the same. The address has to be set manually from a dropdown
list.
Conditional Comman is convenient e.g. if you want to record a discharge curve of a battery and you don't want it to be
too
deep discharged. Hook up the load via a relay driven by a programmable power supply and turn off the supply
when
the voltage has dropped to your preset level.. New in v1.5 is the "Less than last Max Value" option
which means that
the target value is updated for each setting if it is higher
than the previous target value. With this you
can record a rising
value and stop the recording if it starts to drop. Useful for charging batteries.
Create a chart using MS Excel:
This example was done on a 1.5 kHz
sine signal
which was very slowly and very little FM modulated to get varied measurements.
Measurement were done every 2 seconds during one minute
using a Tek
11301 oscilloscope.
To enter the measurement data into MS
Excel select "Open Current Log File with Excel" in the File Menu.
To do that the path to the MS Excel.exe file must have
been properly defined, also done from the File Menu.
From v2.1 the
data can also be entered into the CreateChart.xlsm Excel macro file if the path
to it has been defined.
Once in the Excel
sheet several functions are available by keyboard shortcuts. Do Ctrl+h to find
out or open the Help sheet hidden behind this sheet.
You must have a NI GPIB card with the
proper drivers installed. Find
and download National Instruments GPIB card drivers here.
It is expected to work on any PC/win
OS (not 3.1) with a correctly installed and working NI card.
Download
Measurement Logging here
NOTE ! Uninstall the older version before installing this version or
manually replace the exe-file.
The ini-file from v1.0 is not be compatible with
other versions
below 1.40 so you'd have
to delete it too. v1.40 and up doesn't use the ini-file.
v1.1 and higher are OK
but some saved entries on Conditional Commands window may have to be corrected.
Some Conditional Commands settings from earlier versions may not be correct when
v1.5 or 2.0 has been installed.
Download an Excel file (2.0) with macros to load data, create chart, save data and print a chart only
From this version of the main program the macro file is also included in the
setup and is located in the MeasLog program file.
NOTE: If there is problems
with the Excel file macros follow the instructions
here.
Download a sample printout of a discharge sequence
of an 18650 LiIon battery.
Email me with comments /Håkan
Home / Go back